Billionaire's Portfolio
Currencies

Geographic Location


ETF's

Stocks
World Indices

8000
85

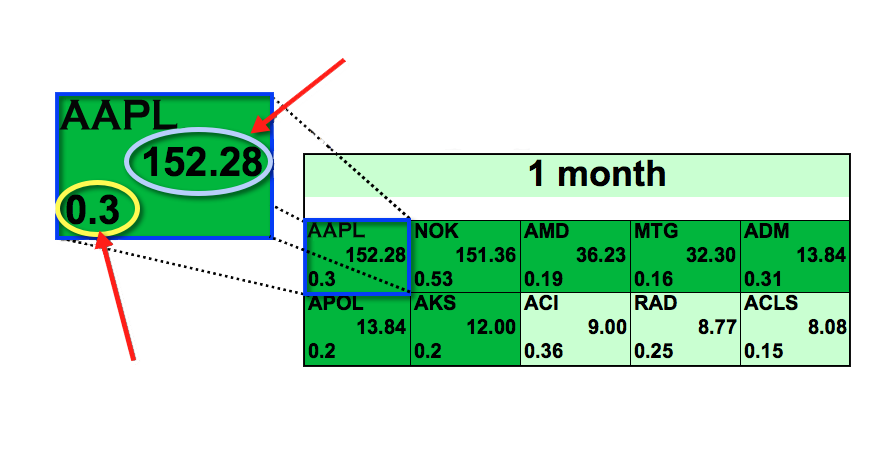
Asset Ticker

AAPL
At the top, a specific asset is identified.
Signal Strength
Predictability
Dr. Lipa Roitman, a scientist with over 35 years of experience created the market prediction system.
The algorithm has been in development for over 20 years, and available for professional investors since 2010.
The algorithm is based on artificial intelligence, machine learning, artificial neural networks and genetic algorithms.


Gold & Commodities
Interest Rates

Strong Buy
Signal > 10
Buy
Signal > 0
Strong Sell
Signal < -14
Sell
Signal < 0
Long
Short


15
54
600
51
50
Heat Map Indicators
gold-prediction.com
Time Ranges
Every I Know First package sends out 6 different heat map forecasts for the corresponding time ranges. As the time increases the algorithm is better able to predict the assets movement and so the signal strength and predictability indicators become stronger.
Short, Medium and Long Term Forecasts

3 Days, 7 Days, 14 Days.
1 Month, 3 Months.
1 Year
Other Strategy Oriented Packages
Sector
Color Coding
For information about algorithmic solutions for private investors click here
For information about algorithmic solutions institutional investors click here
For the most recent I Know First Research articles and news click here
Want to know just how accurate our predictions are ? click here

Disclaimer:
I Know First-Daily Market Forecast, does not provide personal investment or financial advice to individuals, or act as personal financial, legal, or institutional investment advisors, or individually advocate the purchase or sale of any security or investment or the use of any particular financial strategy. All investing, stock forecasts and investment strategies include the risk of loss for some or even all of your capital. Before pursuing any financial strategies discussed on this website, you should always consult with a licensed financial advisor.

Real Estate
Many More
Risk
Risk Conscious
Aggresive Stocks
Conservative Stocks
Market Cap
Small Cap

Assets We Track
currency-prediction.com
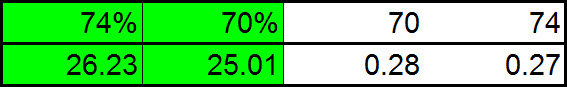
This indicator represents the predicted movement direction/trend; not a percentage or specific target price. The signal strength indicates how much the current price deviates from what the system considers an equilibrium or “fair” price.
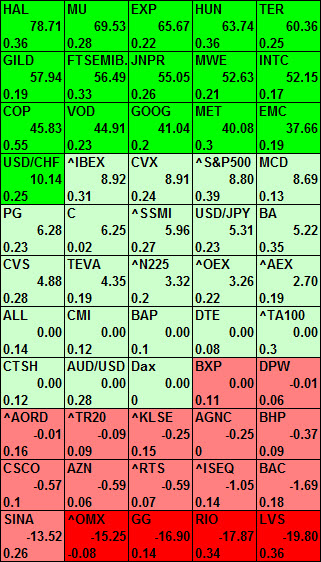
The signal strength is the absolute value of the current prediction of the system. The signal can have a positive (predicted increase), or negative (predicted decline) sign. The heat map is arranged according to the signal strength with strongest up signals at the top, while down signals are at the bottom. The table colors are indicative of the signal. Green corresponds to the positive signal and red indicates a negative signal. A deeper color means a stronger signal and a lighter color equals a weaker signal.
Analogy with a spring: The signal strength is how much the spring is stretched. The higher is the tension the more it’ll move when the spring is released.
This measures the importance of the signal. The predictability is the historical correlation between the prediction and the actual market movement for that particular market. For each asset this indicator is recalculated daily. Theoretically the predictability ranges from minus one to plus one. The higher this number is the more predictable the particular asset is. If you compare predictability for different time ranges, you’ll find that the longer time ranges have higher predictability. This means that longer-range signals are more important and tend to be more accurate.
I Know First is a financial services firm that utilizes a state of the art self-learning algorithm to analyze, model and predict the stock market. The algorithm generates predictions for over 10,000 assets from 3-days to one year ahead.

Heat Maps

152.28
0.3
Tech Stock
Utility
Banks
Insurance
Medium Cap
Large Cap
Mega Cap
Dividend Stock Forecast